
Figure 1.
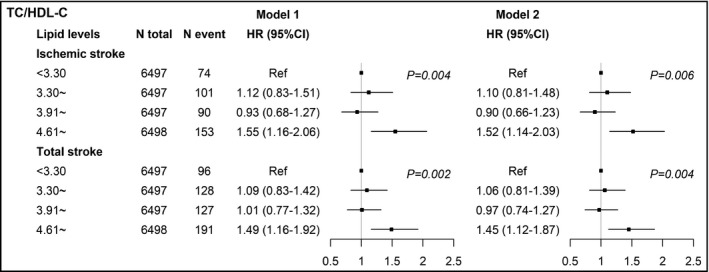
Adjusted hazard ratios and 95% confidence intervals of TC/HDL‐C for ischemic and total stroke in men. Model 1: adjusted age (continuous), BMI (continuous), SBP (continuous), DBP (continuous), cigarette smoking (current/not current), alcohol consumption (current/not current), and use of lipid‐lowering drugs (yes/no). Model 2: adjusted model 1 plus diabetes (yes/no), history of hypertension (yes/no), and family history of CVD (yes/no). TC, total cholesterol; HDL‐C, high‐density lipoprotein cholesterol; HR, hazard ratio