
Figure 4.
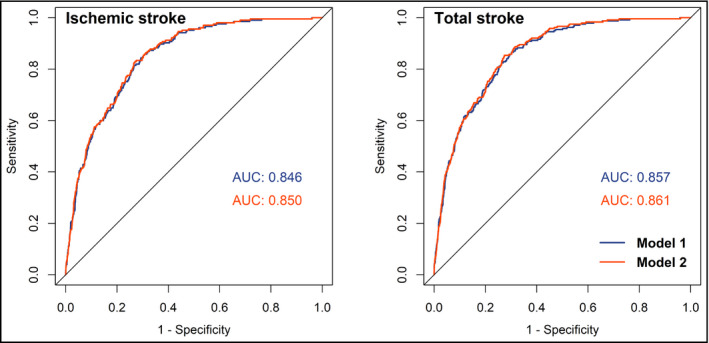
Adjusted ROC curves and AUCs of TG for predicting ischemic and total stroke in women. Model 1: adjusted age (continuous), BMI (continuous), SBP (continuous), DBP (continuous), cigarette smoking (current/not current), alcohol consumption (current/not current), and use of lipid‐lowering drugs (yes/no). Model 2: adjusted model 1 plus diabetes (yes/no), history of hypertension (yes/no), and family history of CVD (yes/no). ROC curves, receiver operating characteristic curves; AUC, area under ROC curve; TG, triglyceride