Figure 1.

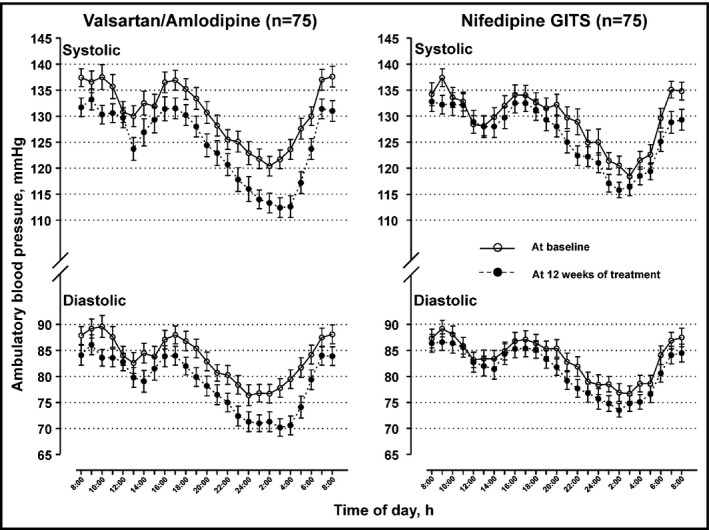
24‐h blood pressure profile at baseline (circle) and 12 weeks of treatment (dot) with the valsartan/amlodipine 80/5 mg single‐pill combination or nifedipine GITS 30 mg. Symbols denote hourly mean. Vertical lines denote standard error

24‐h blood pressure profile at baseline (circle) and 12 weeks of treatment (dot) with the valsartan/amlodipine 80/5 mg single‐pill combination or nifedipine GITS 30 mg. Symbols denote hourly mean. Vertical lines denote standard error