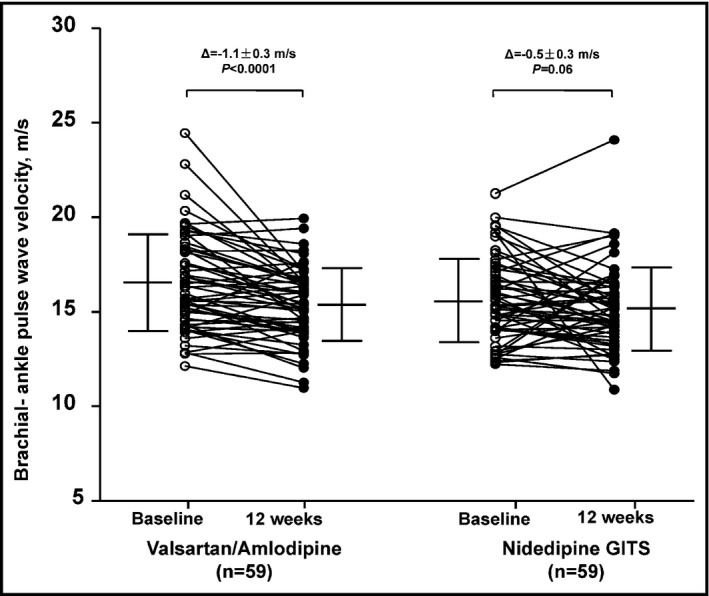
Figure 2.

Changes in brachial‐ankle pulse wave velocity from baseline (circle) to 12 weeks of treatment (dot). Mean values are given alongside with standard deviation (vertical line). The least square mean change ± standard error and P values were adjusted for sex and the baseline age, body mass index, mean arterial pressure, pulse rate, and brachial‐ankle pulse wave velocity, and are given for each randomized group above the graph
