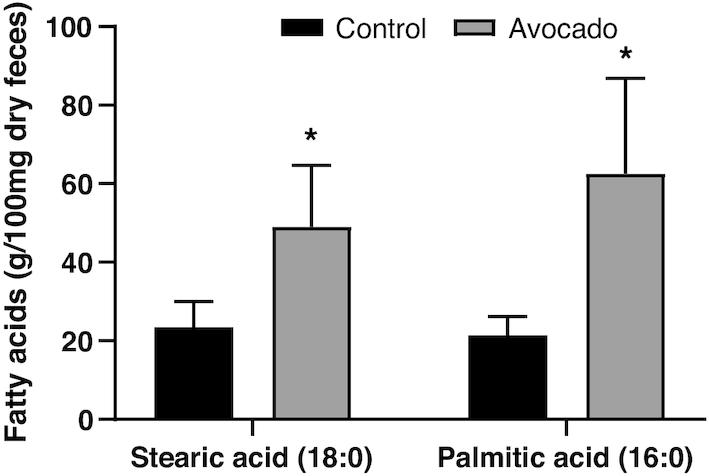
FIGURE 4.

Per-protocol analysis comparisons at 12-wk follow-up of fecal fatty acid concentrations between groups of adults who consumed a daily isocaloric meal with or without avocado. Data were analyzed by univariate ANOVA and are presented as means ± SEMs of the mean (n = 19, control; n = 27, avocado). *Different from control, P ≤ 0.05.
