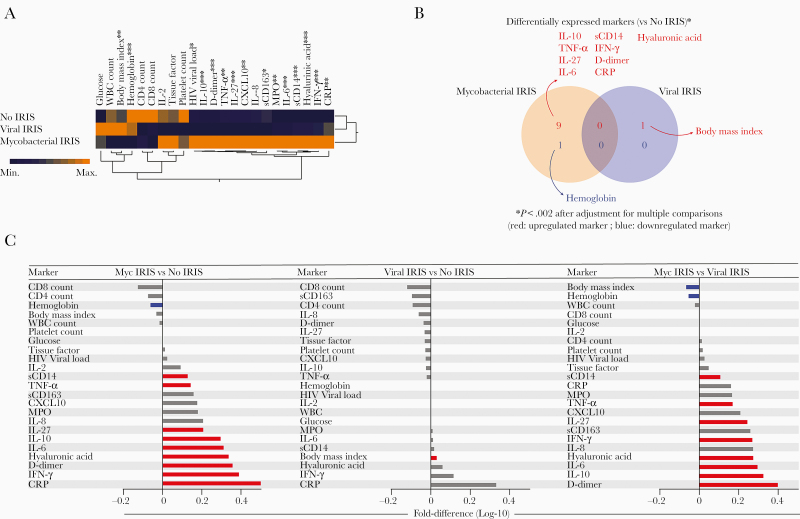
Figure 1.
Mycobacterial IRIS patients exhibit a distinct inflammatory biosignature of plasma markers compared to no IRIS and viral IRIS. Plasma samples were assessed in no-IRIS individuals (n = 409), patients with mycobacterial IRIS (n = 47), or viral IRIS (n = 29). Data were log10 transformed and z-score normalized. A, A hierarchical cluster analysis (Ward method with 100 × bootstrap) was employed to test the overall expression pattern of plasma cytokines, chemokines, and inflammatory markers in the study population. Dendrograms represent Euclidean distance. *P < .05, **P < .01, ***P < .001. B, Venn diagram demonstrates the markers for which values were statistically different between IRIS groups (mycobacterial or viral IRIS) and the no-IRIS group. C, Differences in plasma levels for each IRIS group compared to the no-IRIS group. Differences that reached statistical significance after adjustment for multiple comparisons (adjusted P < .05) are represented in colored bars. Abbreviations: CRP, C-reactive protein; CXCL10, C-X-C motif chemokine ligand 10; HIV, human immunodeficiency virus; IFN-γ, interferon-γ; IL, interleukin; IRIS, immune reconstitution inflammatory syndrome; MPO, myeloperoxidase; Myc, mycobacterial; sCD, soluble cluster differentiation; TNF-α, tumor necrosis factor-α; WBC, white blood cells.

