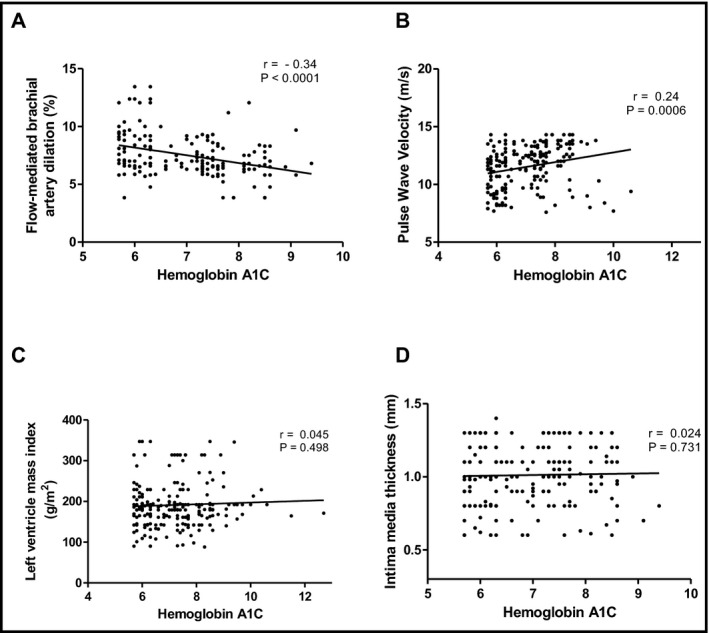
Figure 2.

Simple linear regression plotting glycated hemoglobin (hemoglobin A1C) vs flow‐mediated dilation (A, r = −.34; P value <.001) and pulse wave velocity (B, r = .25; P value = .0006), left ventricular mass index (C, r = .045; P value = .498), and intima‐media thickness (D, r = 0.024; P value = .731) in all resistant hypertension (controlled diabetes mellitus plus uncontrolled diabetes mellitus were plotted together)
