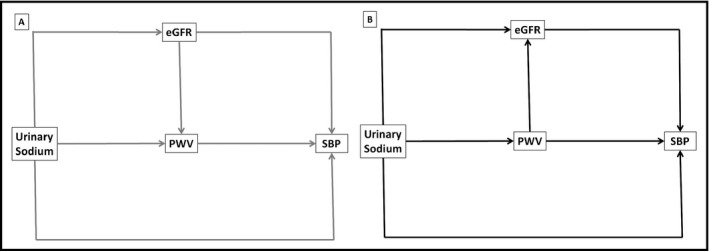
Figure 2.

Hypothetical structural equations models outlining two possible pathways between urinary sodium and systolic blood pressure. A, Model 1 (in grey): eGFR→PWV; B, Model 2 (in black): PWV→eGFR. All models will be adjusted for body mass index, serum uric acid, LDL cholesterol (or HDL cholesterol), urinary albumin/creatinine ratio, serum glucose (or HbA1c), and antihypertensive treatment (only in hypertensive patients). eGFR, estimated glomerular filtration rate; PWV, pulse wave velocity; SBP, systolic blood pressure
