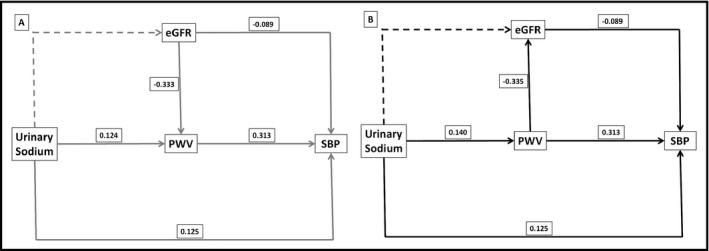
Figure 3.

Path analysis illustrated by the structural equation model with standardized coefficients of direct effects for hypertensive patients. A, Model 1 (eGFR→PWV) is represented in grey lines; B, Model 2 (PWV→eGFR) in black lines. Dashed lines represent non‐significant pathways (tested, but not included in the model) and solid lines represent significant pathways (included in the model). All models are adjusted for body mass index, serum uric acid, LDL cholesterol, urinary albumin/creatinine ratio, serum glucose, and antihypertensive treatment. Using HDL Cholesterol and HbA1c instead of LDL cholesterol did not change the size or the direction of the effects. eGFR, estimated glomerular filtration rate; PWV, pulse wave velocity; SBP, systolic blood pressure
