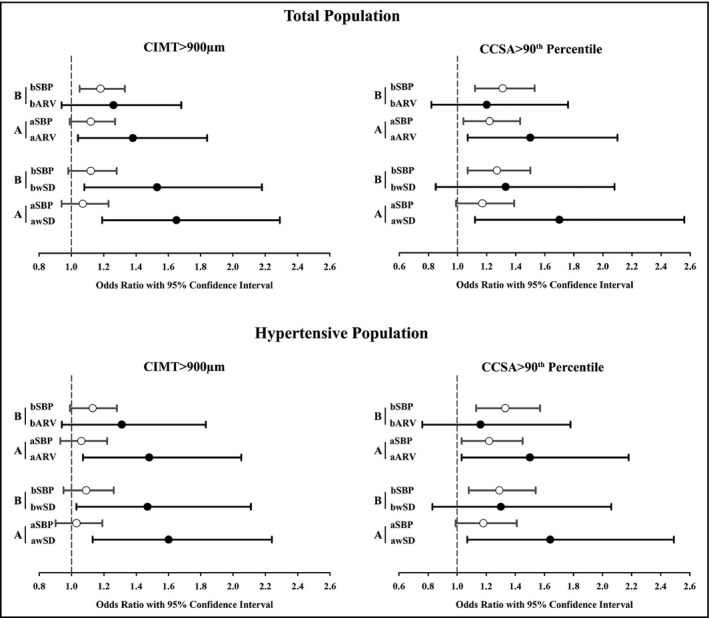
Figure 2.

Multiple logistic regression analysis for the associations of CIMT > 900 μm and CCSA > 90th percentile with brachial and aortic BPVs in total and hypertensive populations. Brachial (B) and aortic (A) multiple logistic regression models with adjustment for age, gender, body mass index, smoking status, antihypertensive treatment, LDL, presence of diabetes, bSBP/aSBP, were conducted in total and hypertensive populations, respectively. Corresponding odds ratio (OR) with 95% Confidence Interval (SBP per 5 mm Hg and wSD/ARV per 1 SD) was shown in the figure. bARV/aARV, average real variability of 24‐hour brachial/aortic SBP; bSBP/aSBP, 24‐hour brachial/aortic mean SBP; bwSD/awSD, time‐weighted standard deviation of 24‐hour brachial/aortic SBP; CCSA, carotid cross‐sectional area; CIMT, carotid intima‐media thickness
