
Figure 1.
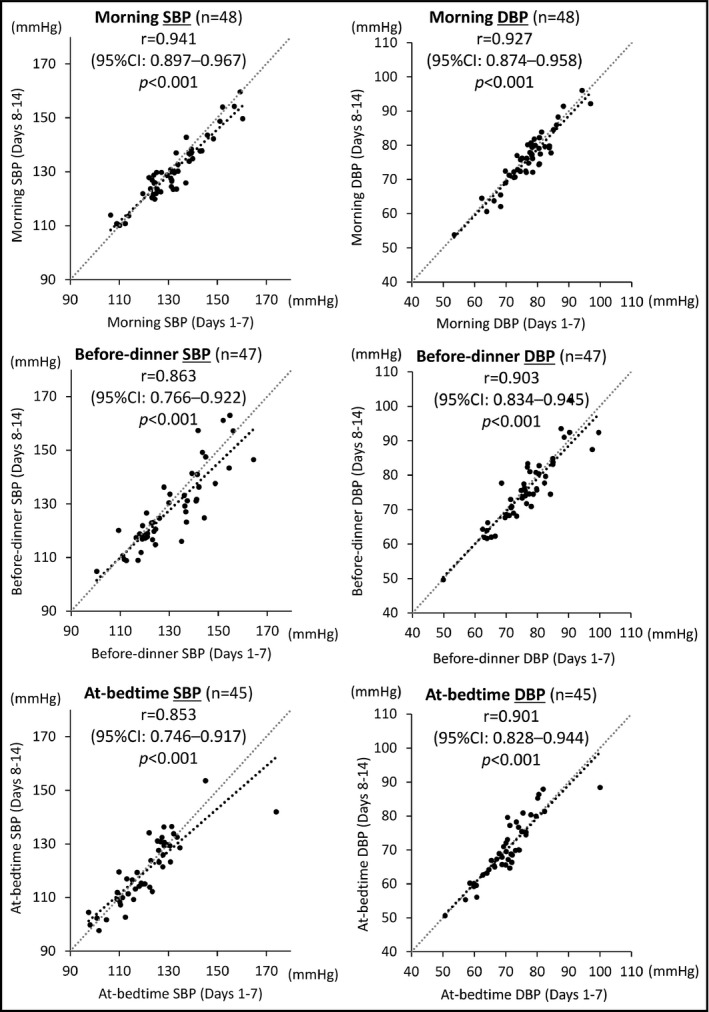
Correlation analysis of home blood pressure (HBP) values recorded during days 1 to 7 and those from days 8 to 14 in the morning, before dinner, and at bedtime. CI indicates confidence interval; DBP; diastolic blood pressure; r, Pearson correlation coefficient; SBP, systolic blood pressure