
Figure 2.
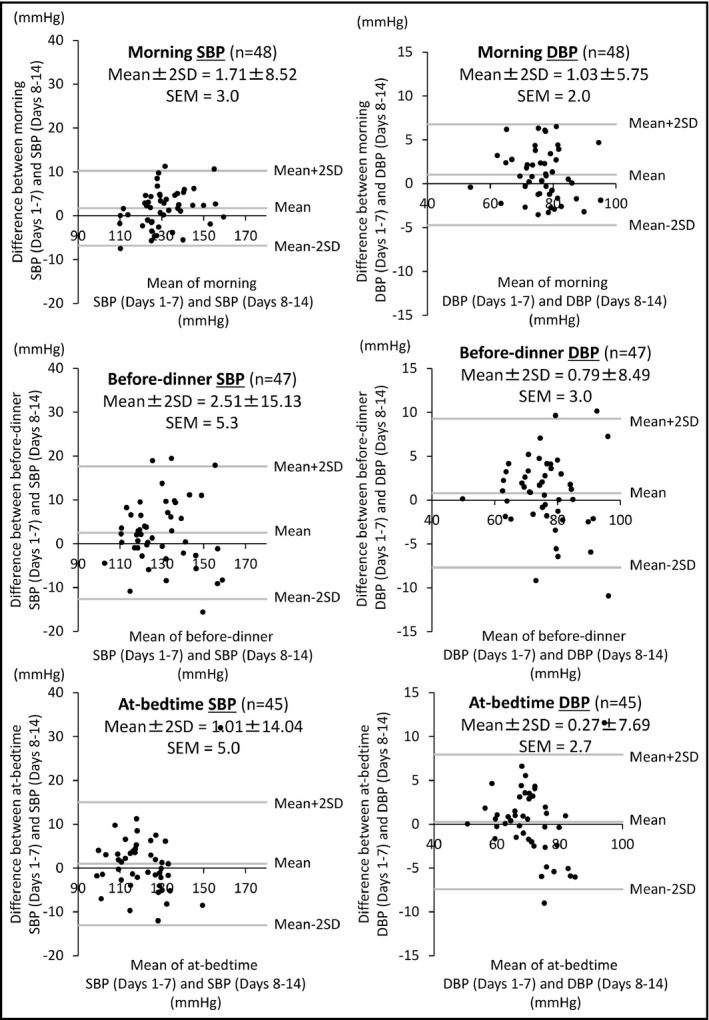
Bland‐Altman analysis comparing the home blood pressure (HBP) values from days 1 to 7 and those from days 8 to 14 in the morning, before dinner, and at bedtime. DBP; diastolic blood pressure; SBP, systolic blood pressure; SD,standard deviation; SEM, standard error of measurement