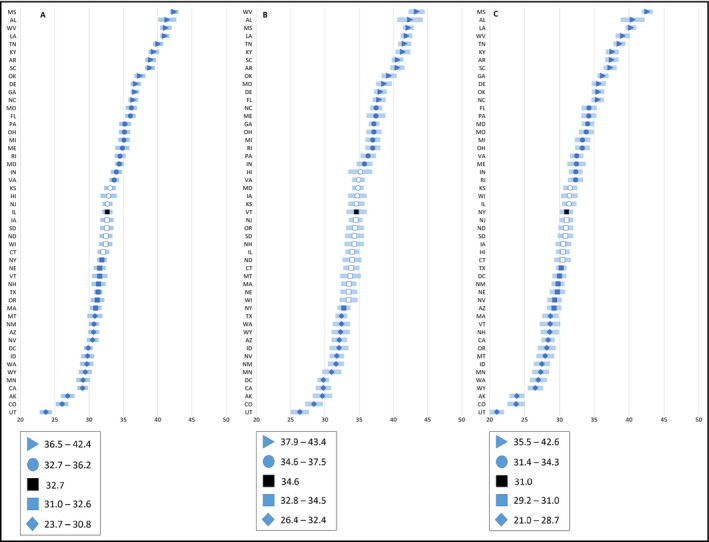
Figure 1.

Model‐predicted prevalence of hypertension among adults (≥20 y) by state and sex—BRFSS 2013/2015. Diamonds represent the first quartile (Q1). Squares indicate the second quartile (Q2). Circles indicate the 3rd quartile (Q3). Triangles indicate the 4th quartile (Q4). Black square indicates the median prevalence of all states. Solid (blue)‐filled shapes are significantly different from the median of all states, while white shapes are not significantly (P‐value <0.05). Panel A, All adults (≥20; Q1 range: 23.7‐30.8; Q2 range: 31.0‐32.6; Q3 range: 32.7‐36.2; Q4 range: 36.5‐42.4). Panel B, Men (Q1 range: 26.4‐32.4; Q2 range: 32.8‐34.5; Q3 range: 34.6‐37.5; Q4 range: 37.9‐43.4). Panel C, Women (Q1 range: 21.0‐28.7; Q2 range: 29.2‐31.0; Q3 range: 31.4‐34.3; Q4 range: 35.5‐42.6). BRFSS, Behavioral Risk Factor Surveillance System
