
Figure 2.
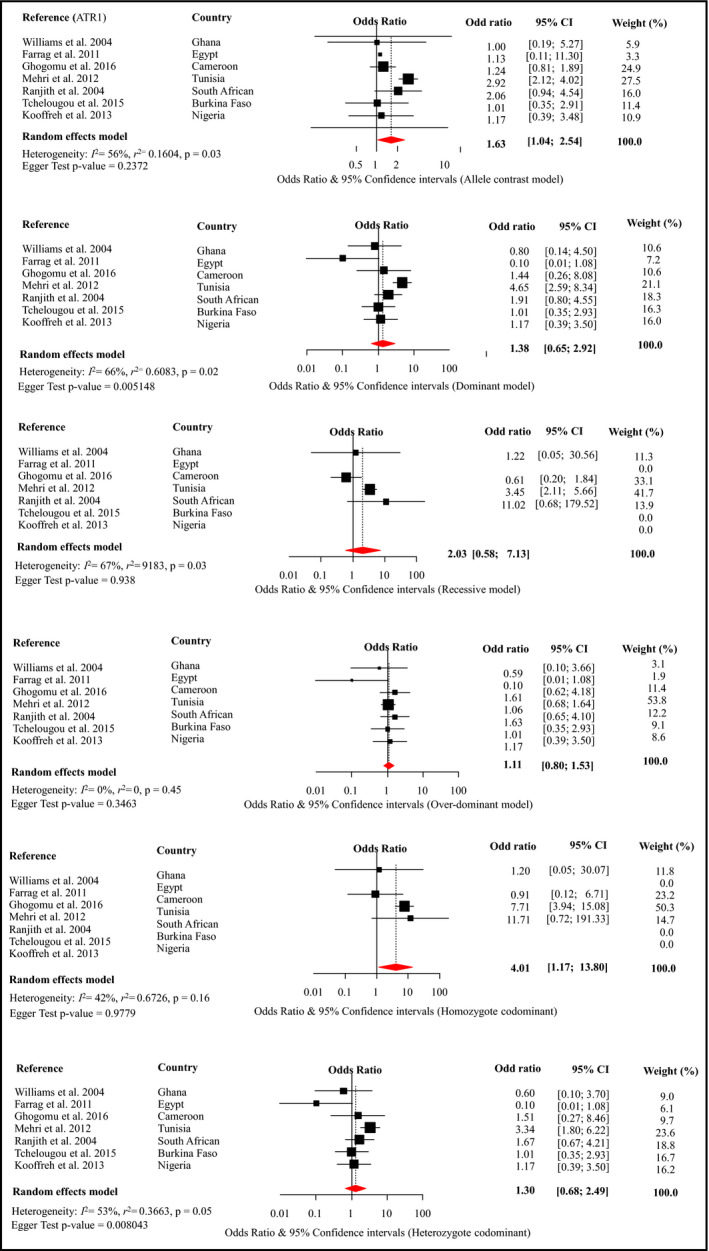
Forest plot for the effects of rs5186 from different genetic models on the risk of hypertension across studies in Africa. Figures panels (top to bottom) are for the “alleles contrast,” “dominant,” and “recessive” models of genetic associations, respectively, for the first column, and “overdominant,” “homozygote codominant,” and “heterozygote codominant” models for the second column. For each figure panel, the black boxes are for the effect estimates (odd ratio) of the association, and the horizontal bars are for the 95% confidence interval (CI). The sizes of the boxes are proportional to the inverse variance of the effect estimates. The diamond beneath the black boxes is for the overall effect estimates across studies, from random effects model meta‐analysis. A dotted vertical line centered on the diamond has been added to assist visual interpretation. For each contributing study, the odd ratio and 95% CI are also shown, together with the weight (in percentage), reflecting the contribution of the study to the overall estimates. The horizontal bar (x‐axis) is on log scale to allow a balanced distribution of the CIs around the effect estimates. The heterogeneity statistics are also shown. ATR1 indicates angiotensin II type 1 receptor