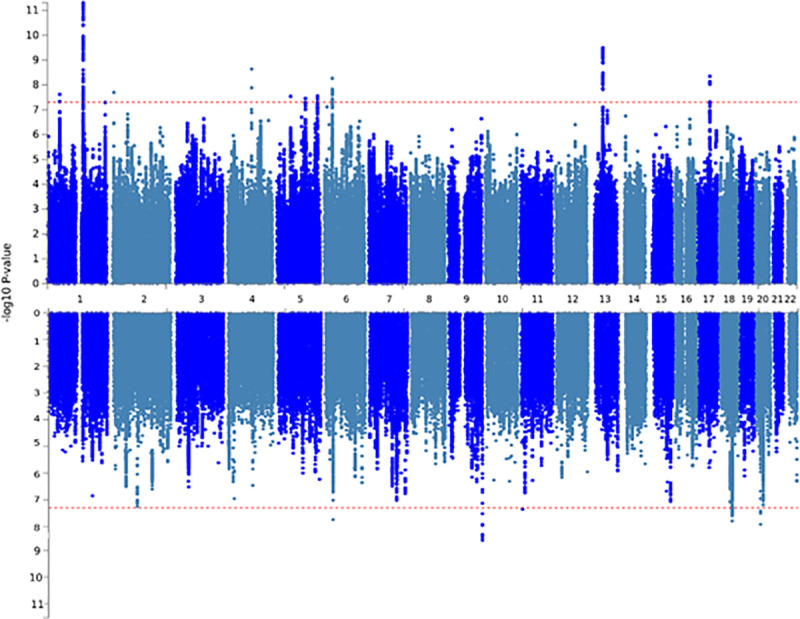
Fig 1. Manhattan plots for the stratified GWAS analyses.

Upper panel: female, lower panel: male. Red dotted line indicates genome-wide significant p-value threshold.

Upper panel: female, lower panel: male. Red dotted line indicates genome-wide significant p-value threshold.