
Figure 3.
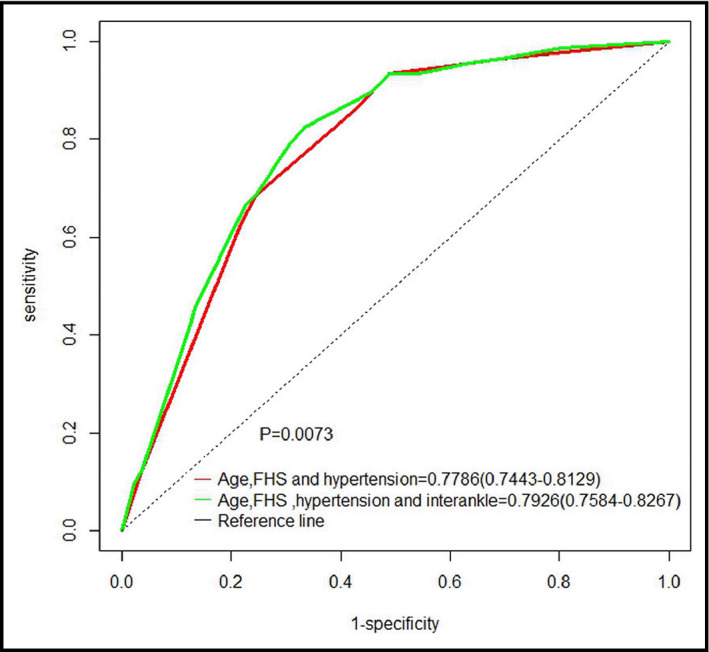
Incremental prognostic value of an interankle systolic blood pressure (SBP) difference ≥7 mm Hg for stroke. The red line represents the area under the receiver operating characteristic (ROCAUC) curve estimated for a regression model with independent risk factors for stroke (age, family history of stroke [FHS], and hypertension), and the green line represents ROCAUC estimated for a model consisting of the same factors plus interankle SBP difference ≥7 mm Hg as a categorical variable, both in relation to a dichotomous outcome of history of stroke (with vs without).