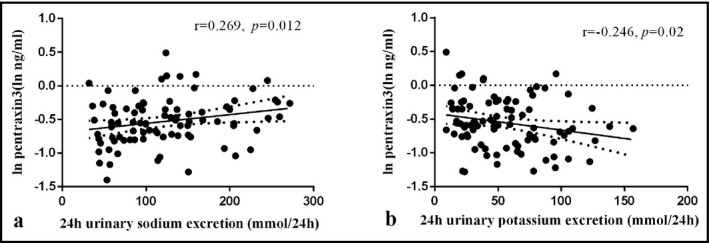
Figure 3.

The correlations between 24 h urinary sodium excretions during low‐ and high‐salt periods (A), 24 h urinary potassium excretions during high‐salt and high‐salt plus potassium periods (B) and ln‐transformed PTX‐3. Pearson correlation tests were done while correlation analyses
