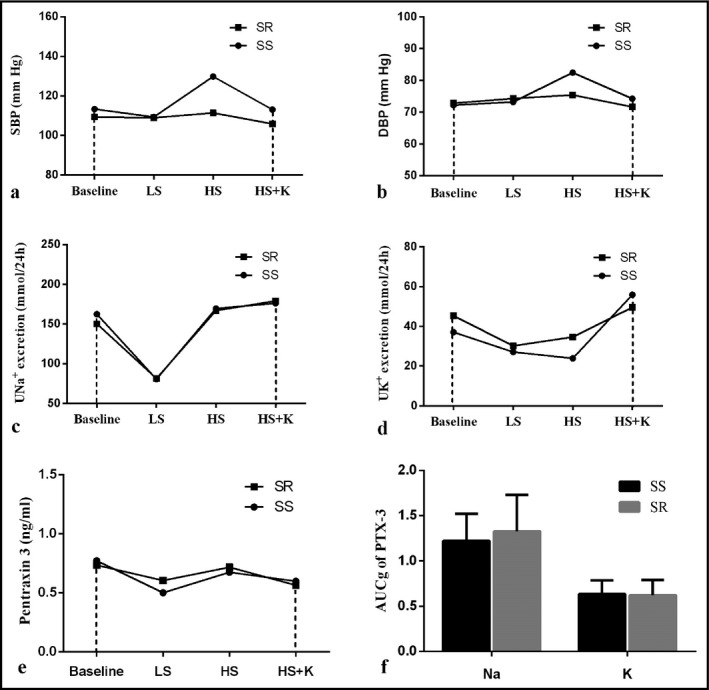
Figure 4.

Delineate the AUCg of SBP (A), DBP (B), 24 h urinary sodium (C) and potassium (D) excretion, plasma PTX‐3 (E) during interventions by salt sensitivity. F, Showed the separate effects of sodium and potassium on the plasma level of PTX‐3 divided by salt sensitivity. Differences between SS and SR group were compared via unpaired Student's t test. AUCg, area under curve with respect to ground; DBP, diastolic blood pressure; LS, low‐salt period; HS, high‐salt period; HS + K, high‐salt plus potassium period; PTX‐3, pentraxin 3; SBP, systolic blood pressure; SR, salt‐resistant participants; SS, salt‐sensitive participants
