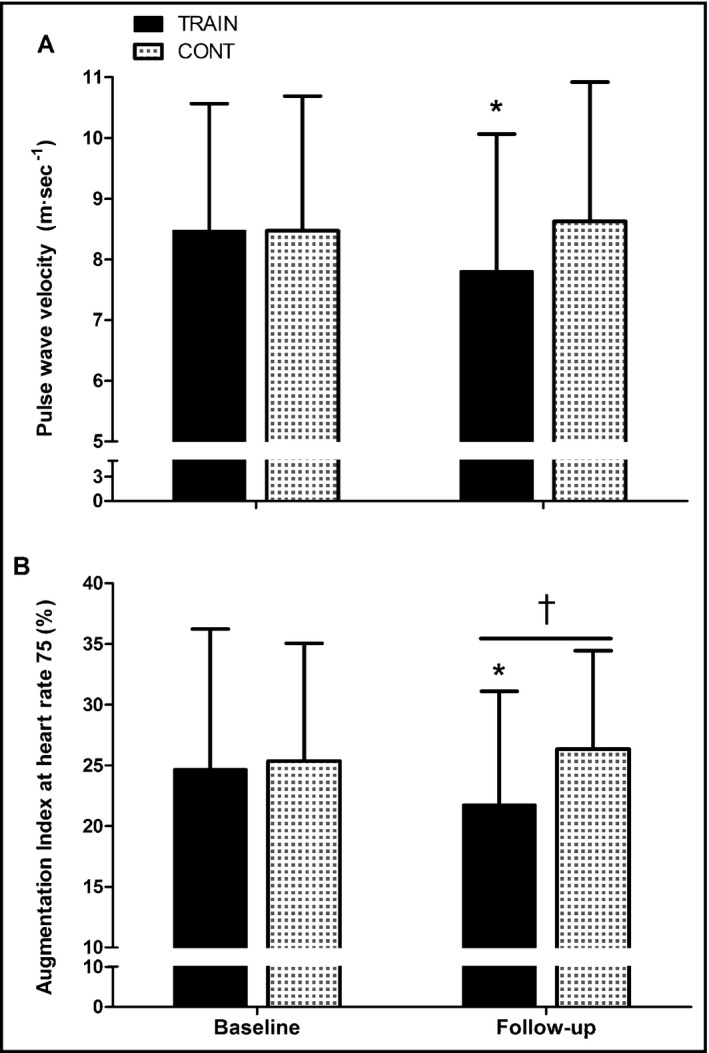
Figure 2.

Changes in (A) pulse wave velocity from the carotid to the femoral artery and (B) augmentation index normalized to a heart rate of 75 beats·min−1 in the training (n = 23) and control(n = 23) groups before and after 6 months of treatment. Data are expressed as mean±standard deviation. *Significant difference from baseline within that group. †Significantly different from controls at that time point (all P < .05)
