
Figure 5.
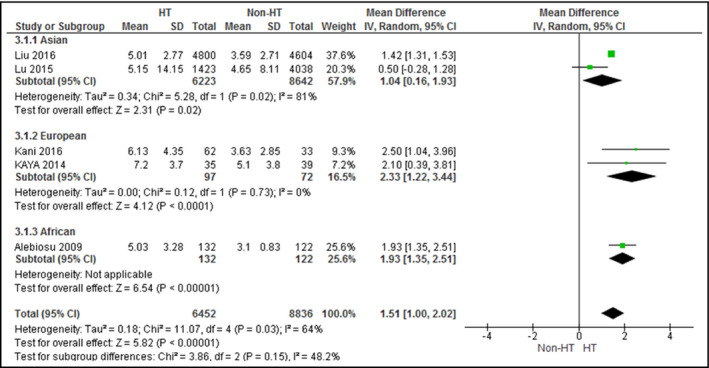
Forest plot for sleep quality scores between patients with and without hypertension. CI indicates confidence interval; SD, standard deviation
Official websites use .gov
A
.gov website belongs to an official
government organization in the United States.
Secure .gov websites use HTTPS
A lock (
) or https:// means you've safely
connected to the .gov website. Share sensitive
information only on official, secure websites.
Forest plot for sleep quality scores between patients with and without hypertension. CI indicates confidence interval; SD, standard deviation