Fig 4.

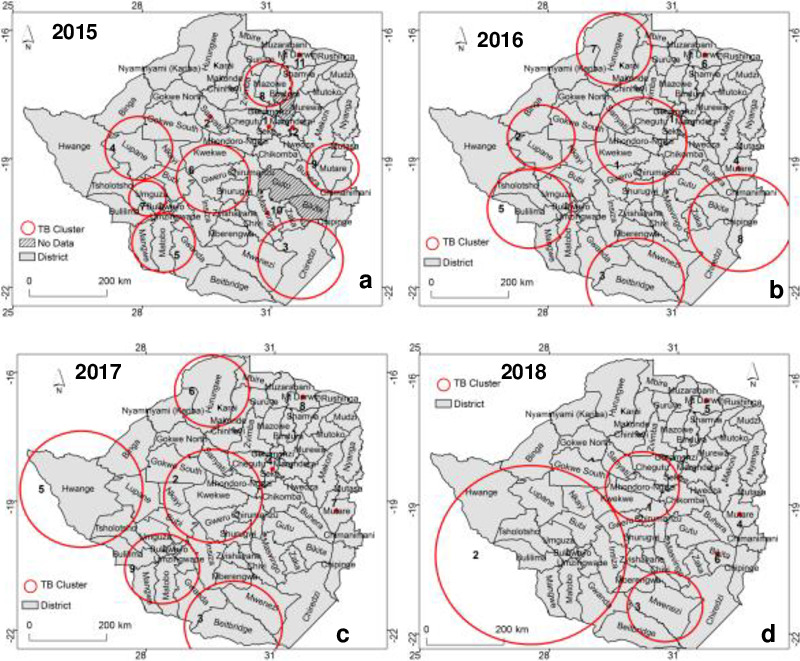
Spatial distribution of statistically significant primary and secondary TB clusters detected by purely spatial analysis based on the Gini coefficient for a) 2015, b) 2016, c) 2017 and d) 2018.

Spatial distribution of statistically significant primary and secondary TB clusters detected by purely spatial analysis based on the Gini coefficient for a) 2015, b) 2016, c) 2017 and d) 2018.