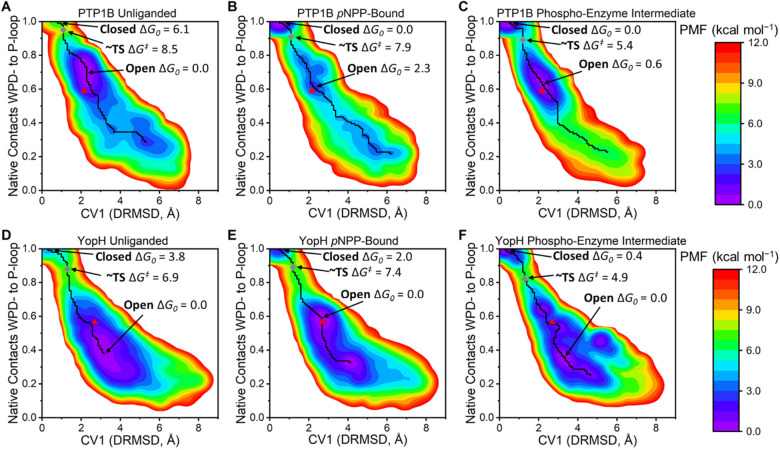
Figure 4.
Changes in the WPD-loop free energy landscape over the catalytic cycle of PTP1B and YopH as determined by our PT-MetaD-WTE simulations. (A–C) PMFs of the unliganded, pNPP-bound, and phospho-enzyme intermediate states of PTP1B and (D–F) those for YopH. The x-axis is the metadynamics simulations’ collective variable 1 (CV1), which is the interdistance RMSD (DRMSD) between the WPD-loop and P-loop Cα carbons (using the closed conformation as the reference state). The y-axis is the fraction of native contacts72 formed between the Cα carbons of the WPD-loop and P-loop (values decreasing from one mean a move away from the reference state, the closed X-ray structure, defined in detail in the Supporting Information). In all cases, the minimum free energy pathway (MFEP) between the closed and open states is plotted as a black line. The minimum energy values of the closed and open states are indicated, alongside the size of the pseudo TS barrier (gray diamond) between the two states. The representative X-ray structure of the open (PTP1B, 6B90(6) and YopH, 1YPT(32)) conformation is shown as a red triangle. Note that the closed state (PTP1B, 6B90(6) and YopH, 2I42(7)) has the coordinates (0,1) and that PDB ID 6B90(6) contains both a closed and open WPD-loop conformation.

