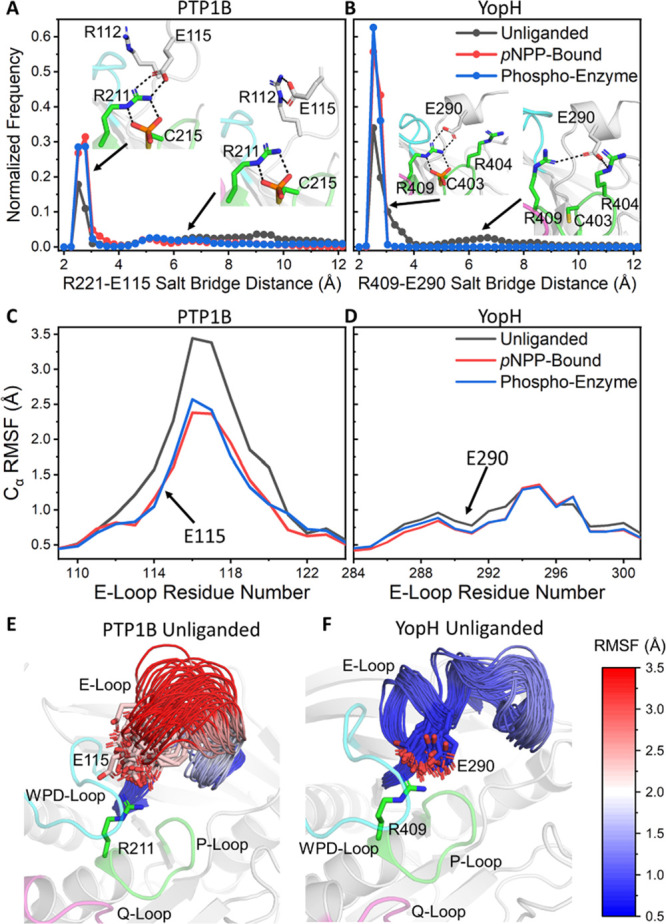
Figure 5.

Differences in the structural stability of the E-loops of PTP1B and YopH from our PT-MetaD-WTE simulations. (A and B) Normalized histograms of the P-Loop arginine to the E-loop glutamic acid salt bridge distance from each our simulations of (A) PTP1B and (B) YopH for the unliganded, pNPP-bound, and phospho-enzyme intermediates states of both enzymes. The figures show representative conformations for each protein with and without the salt bridge formed. (C and D) RMSFs of the Cα atoms of the E-loop residues, obtained from our PT-MetaD-WTE simulations of (C) PTP1B and (D) YopH in all three states simulated. (E and F) Representative structures of the conformational sampling/diversity of the E-loops of (E) PTP1B and (F) YopH, in the unliganded states of each enzyme. E-loop residues are colored mapped from red (most flexible) through white and to blue (least flexible) according to their calculated Cα RMSF.
