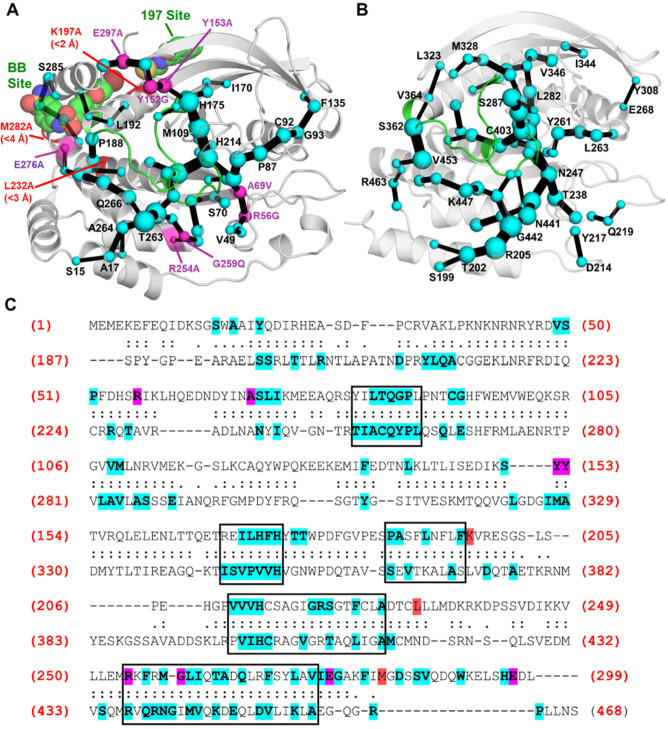
Figure 6.
Identification of key residues and pathways utilized for allosteric communication in (A) PTP1B and (B) YopH, determined using the shortest path map (SPM) method.52 SPMs for both PTPs were calculated using our PT-MetaD-WTE simulations with pNPP-bound. The sizes of the spheres and edges are proportional to the number of pathways found through the residue (spheres) or between two residues (edges) (a larger size means more pathways and therefore more importance for allosteric communication). For PTP1B, non-WPD or P-loop mutations found on the SPM that are known to alter PTP1B activity by > |50%| are shown as purple spheres, with mutations not found on the SPM colored red. For mutations not found, the closest heavy atom distance to an SPM residue is indicated. The two known allosteric drug binding sites (BB and 197) are also depicted with a representative drug bound in each position using PDB IDs 1T49(75) and 6B95,6 respectively. (C) Structure-based sequence alignment of PTP1B and YopH, with all aligned residues marked with either a “:” or “.” (residues marked with a “:” have a Cα–Cα distance within 5 Å of one another). All residues in PTP1B and YopH found on the SPM are highlighted in blue, with those known to affect enzyme activity (same criteria as in (A)) highlighted in purple if on the SPM or in red if not on the SPM. Boxes are used to highlight regions that have a high frequency of SPM residues in both PTPs. Structural alignment was performed using TM-align.78 PDB IDs 6B90(6) and 2I42(7) were used to describe PTP1B and YopH, respectively.

