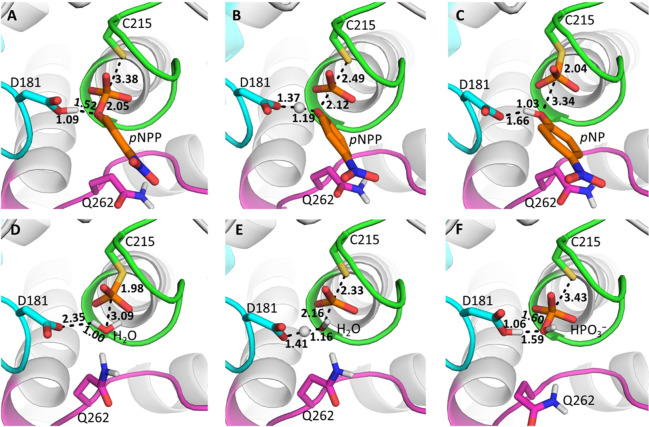
Figure 9.
Representative structures of (A) the Michaelis complex, (B) the transition state for the cleavage step, (C and D) the phospho-enzyme intermediate, (E) the transition state for the hydrolysis step, and (F) the final product complex, for the PTP1B-catalyzed hydrolysis of pNPP (see Figure S16 for equivalent YopH results). The structures shown here are the centroids of the top ranked cluster obtained from RMSD clustering of 30 individual EVB trajectories of each stationary or saddle point, performed as described in the Supporting Information. Average reacting distances for each catalytic step are also shown.

