
Fig 2. Relative abundance for the top 20 most abundant genera are shown for each population in the cross-sectional study.
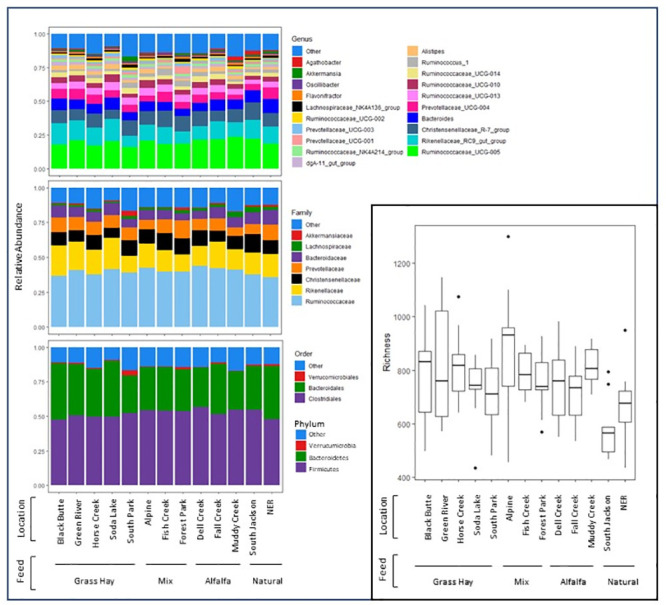
Fill color indicates genus (top left), family (middle left) or order/phylum (bottom left). Amplicon sequence variant-level richness and alpha diversity for each population is shown in the inset (bottom right) where the midline indicates the median values, hinges indicate the first and third quartiles, whiskers extend up to 1.5 the interquartile range, and outliers beyond this range are represented as individual points. Populations are grouped by diet at the time of sample collection. Note that cross-sectional samples from the National Elk Refuge (NER) were collected prior to commencement of feeding at that location.