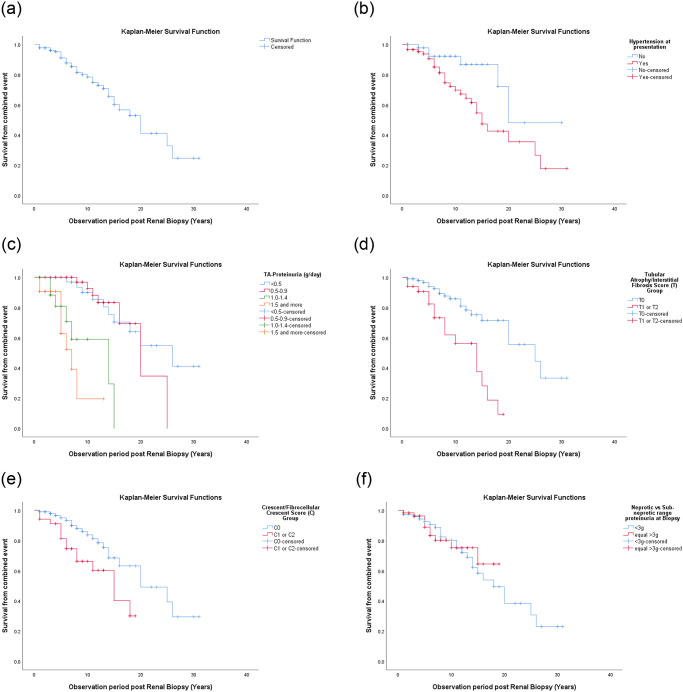
Fig 1. Primary endpoint analysis, i.e., time to first occurrence of combined event of 50% decrease in eGFR or ESRD.
(a) Kaplan-Meier curves showing survival from combined event in the entire cohort, categorized by, (b) presence of hypertension at clinical presentation (c) degree of TA-proteinuria, (d) tubular atrophy/interstitial fibrosis (T) score (e) cellular/fibrocellular crescent (C) score and (f) nephrotic range proteinuria (NRP) with sub-nephrotic range proteinuria at biopsy.

