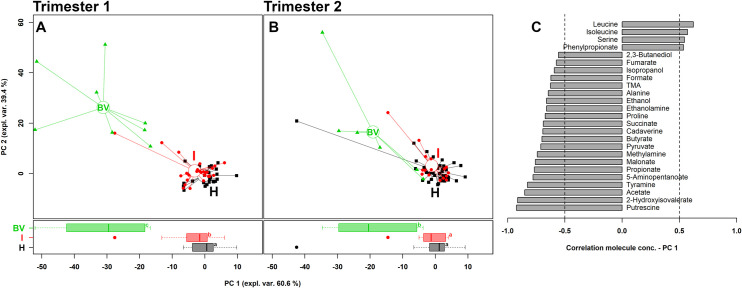
Fig 1. rPCA model built on the centred and scaled concentrations of the metabolites showing significant differences between groups.
In the scoreplots (A: first trimester; B: second trimester), women with a healthy vaginal status (H), an intermediate flora (I) and a BV-related microbiota (BV) are represented in black, red and green respectively, with lines connecting each subject to the median of its group. Below, the respective boxplots represent the distribution of PC1 values of the women groups (a, b, c: equal letters indicate absence of statistical significance whereas different letters highlight a significant difference between the groups). In the barplot (C), describing the correlation between the concentration of each molecule and its importance over PC1, dark grey bars highlight statistically significant correlations (P<0.05).

