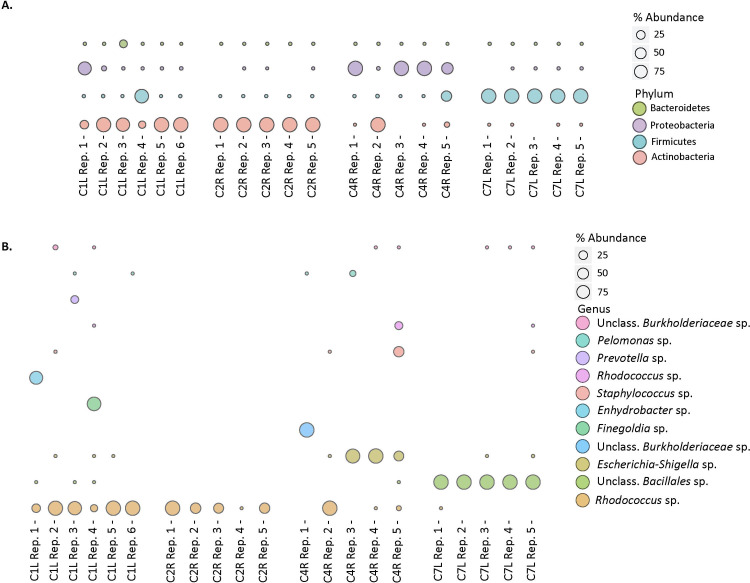
Fig 1. Microbial community composition.
(a) Distribution of 16S rRNA sequences of the 4 most abundant phyla in replicate capsular samples. Bubble size per phylum represents the percentage of the total reads for each sample. (b) Distribution of the most abundant 16S rRNA sequences classified at the genus level, in replicate capsular samples. Bubbles size per genus represents the percentage of the total reads for each sample.

