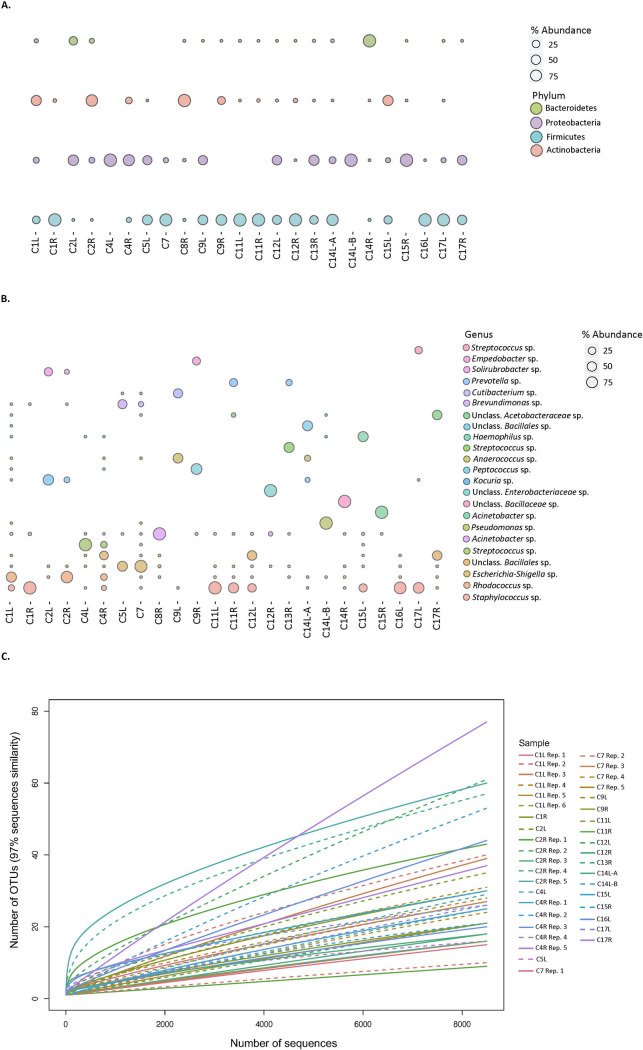
Fig 2. Microbial community composition.
(a) Distribution of 16S rRNA sequences of the 4 most abundant phyla in capsular samples. Bubbles size per phylum represents the percentage of the total reads for each sample. (b) Distribution of the most abundant 16S rRNA sequences classified at the genus level, in capsular samples. Bubbles size per genus represents the percentage of the total reads for each sample. (c) Microbial diversity of breast capsule samples sequenced. Rarefaction curves are based on sequences with 97% sequence identity. Parentheses denote paired right and left breast samples. Note sample C8R and C14R were excluded from rarefaction analysis as the samples had half the number of total sequence reads compared to other samples.

