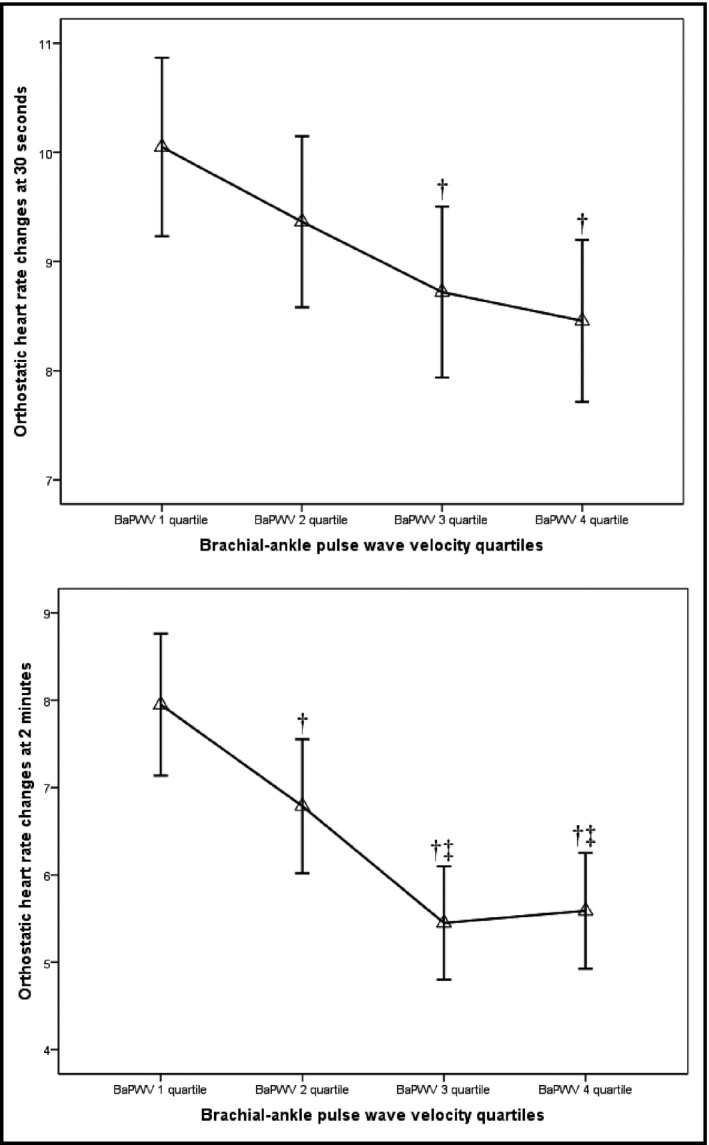
Figure 2.

Mean orthostatic heart rate change according to brachial‐ankle pulse wave velocity (BaPWV) quartiles. The triangles represent the mean levels of orthostatic heart rate change and the lines represent the corresponding 95% confidence intervals. †P<.05 vs quartile 1. ‡P<.05 vs quartile 2.
