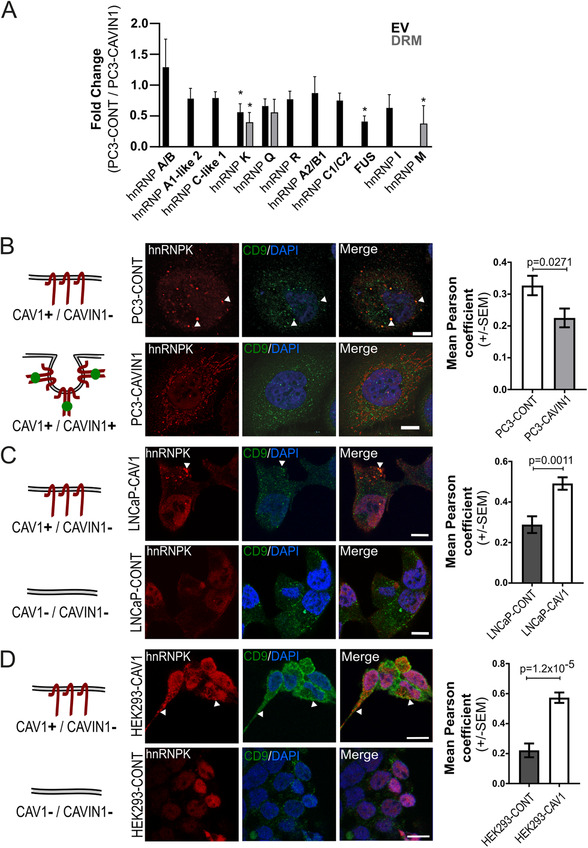
FIGURE 2.

Non‐caveolar CAV1 regulates hnRNPK localisation. (A) hnRNP family member abundance in EV and DRM fractions shown as fold change between PC3‐CAVIN1 and PC3‐CONT cells (CAVIN1/CONT) originally reported in. 3 n = 3, error bars represent standard deviation. *p ≤ 0.05. (B–D) Diagrams (left) depict the CAV1 and CAVIN1 status of each cell line used. Confocal immunofluorescent microscopy of hnRNPK (red) and CD9 (green) MVB marker in three cell systems: (B) PC3 cell line with and without CAVIN1 (PC3‐CAVIN1 and PC3‐CONT, respectively); ectopically expressed CAV1 in LNCaP (C) and HEK293 (D) cell lines. White arrows point to example areas of co‐localisation. All scale bars indicate 10 μm. Quantitative co‐localisation analysis (right) was performed using Pearson correlation on 10 regions of interest for each condition from three to four biological replicates (composite images for all replicates used in co‐localisation analysis available in Figure S2, S3 and S4). A two‐sided unpaired Mann‐Whitney test was used to compare Pearson coefficient values between the conditions
