
Figure 1.
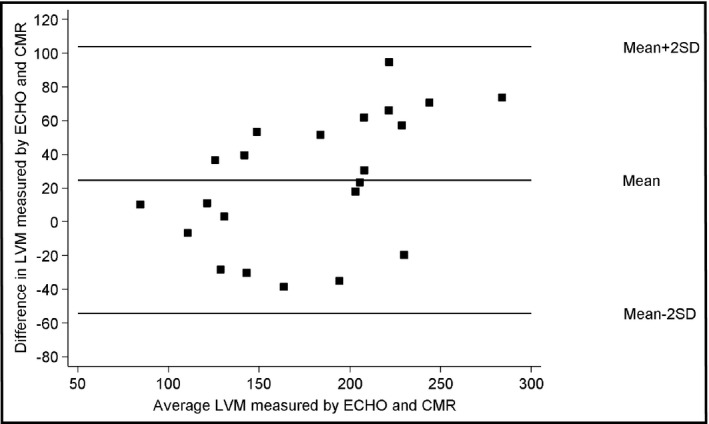
Bland‐Altman plot of left ventricular mass (LVM). ECHO indicates echocardiography; CMR, cardiovascular resonance imaging; SD, standard deviation.
Official websites use .gov
A
.gov website belongs to an official
government organization in the United States.
Secure .gov websites use HTTPS
A lock (
) or https:// means you've safely
connected to the .gov website. Share sensitive
information only on official, secure websites.
Bland‐Altman plot of left ventricular mass (LVM). ECHO indicates echocardiography; CMR, cardiovascular resonance imaging; SD, standard deviation.