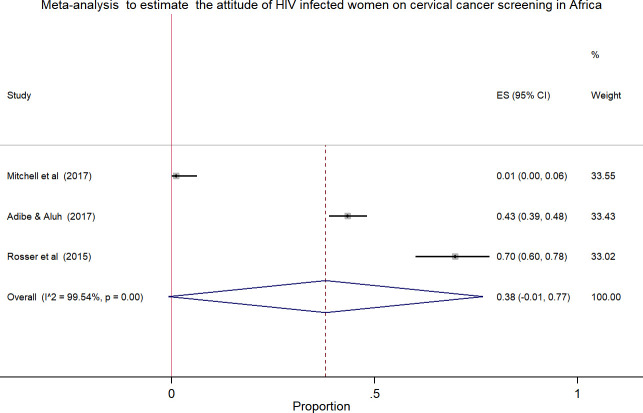
Fig 3. Forest plot to estimates the proportion of attitude among HIV infected women towards cervical cancer screening in Africa with 95% CI (the estimate weighted based on random effects model): ES-Effect size equivalent to the proportion, CI-Confidence interval.
In the plot, the diamond shows the pooled result and the boxes show the effect estimates from the single studies. The purple dotted vertical line indicates pooled estimate. The purple solid vertical line indicates the reference line at zero indicating no effect. The horizontal line through the boxes illustrate the length of the confidence interval and the boxes show the effect estimates from the single studies.

