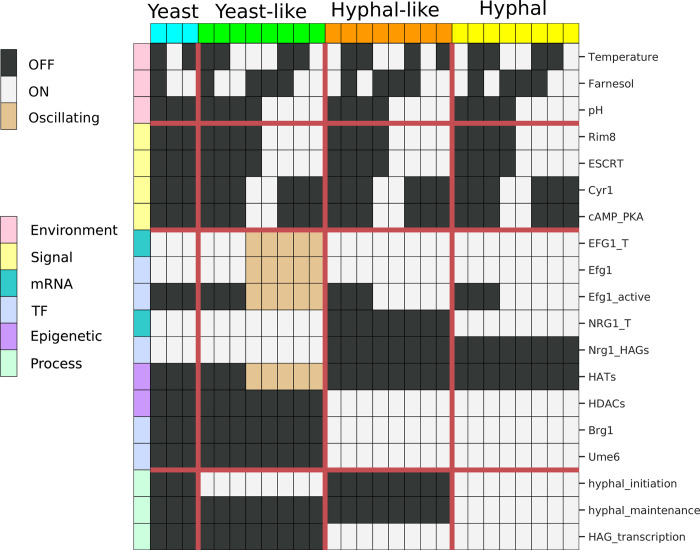
Fig 2. Visual summary of the 27 attractors of the YHT Boolean model.
Each row corresponds to a network node and each column indicates an attractor. White indicates active (ON) nodes, black indicates inactive (OFF) nodes, and beige indicates nodes that oscillate. Individual attractors have been assigned to one of four phenotypes—yeast, yeast-like, hyphal-like, and hyphal—based on the status of the hyphal_initiation, hyphal_maintenance, and HAG_transcription nodes (see text).

