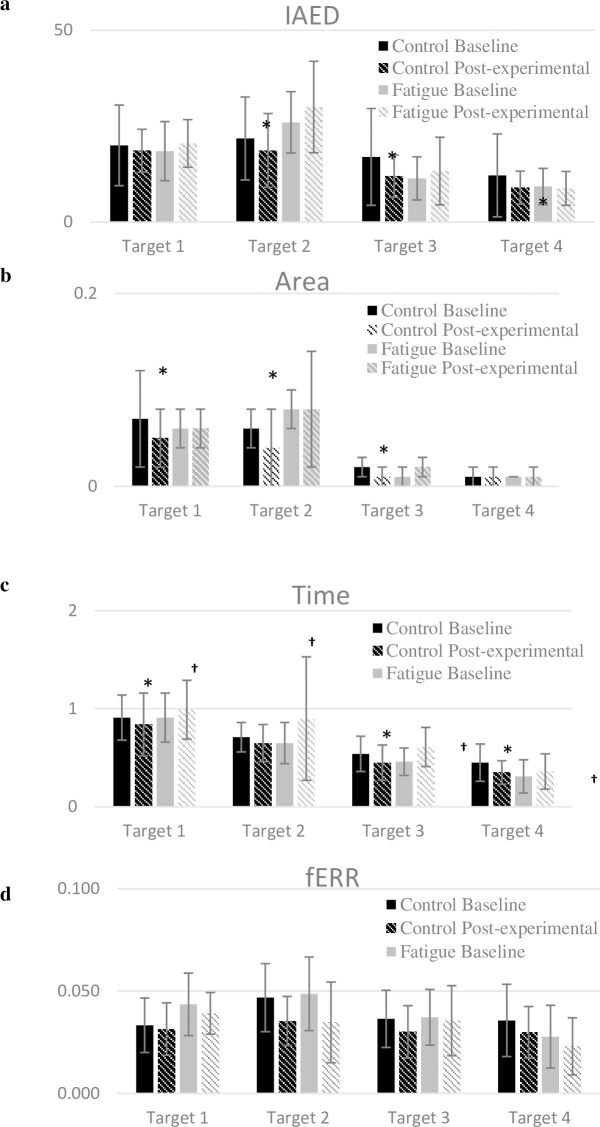
Fig 4. Spatiotemporal data during baseline and post-experimental condition of both groups.
Data are presented as mean±SD of Baseline and Experimental condition for both groups. a: iANG, initial angle of endpoint deviation (°); b: Area, area under the curve (m2); c: Time, time taken to reach the targets (s); d: fERR, final error, arc sign (m). Significant Time effect and Time x Group effect, p<0.05, for iANG, Time and Area. No significant difference for fERR (Time effect: p = 0.226; and Time x Group effect: p = 0,33). *Significant increase of performance for controls compared to baseline, p < 0.05. †Significant decrease of performance compared to baseline, p < 0.05.

