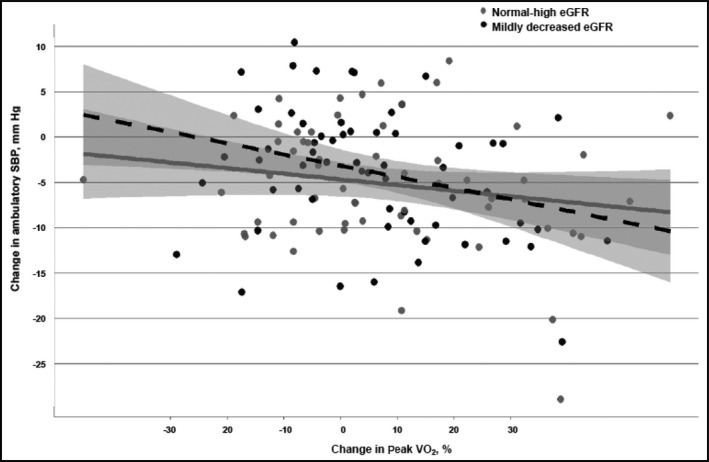
Figure 4.

The relationship between percent change in peak oxygen uptake (VO2) and changes in ambulatory systolic blood pressure (SBP) stratified by estimated glomerular filtration rate (eGFR) group. Change in SBP derived from SBP value at baseline minus SBP value at 4‐month follow‐up visit. The dotted line represents the mildly decreased eGFR group and the solid line represents the normal‐high eGFR group.
