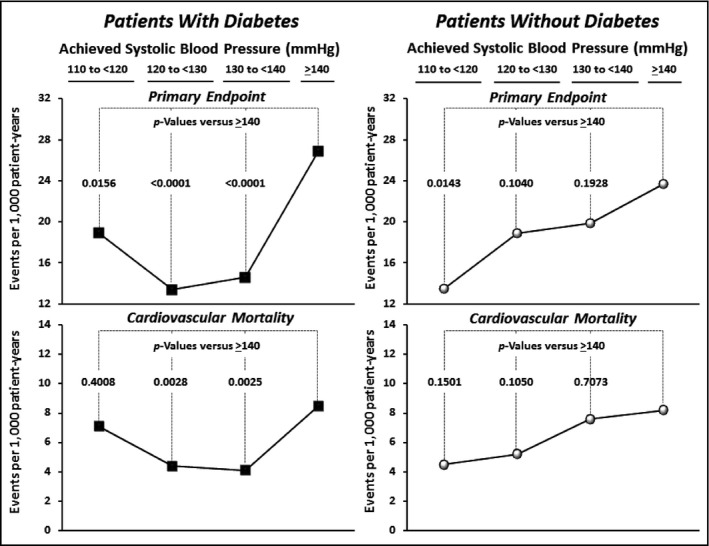
Figure 4.

Event rates (per 1000 patient years) within each of the achieved systolic blood pressure (SBP) categories for the primary study endpoint (cardiovascular [CV] death or nonfatal myocardial infarction or stroke) and for CV death alone shown separately for patients with and without diabetes. None of the differences between adjacent categories was significant except for >140 mm Hg vs <140 mm Hg in the diabetes patients.
