
FIGURE 1.
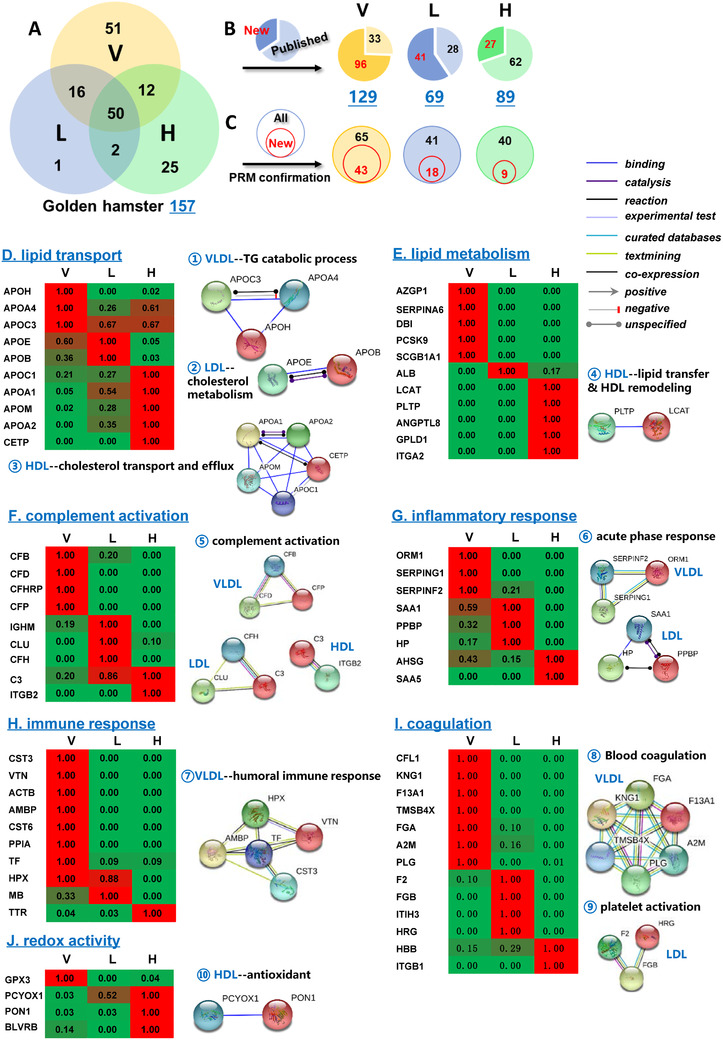
Protein overlaps in VLDL/LDL/HDL of golden hamsters and their specific functions. (A) Venn diagram of identified proteins in VLDL (V), LDL (L), and HDL (H) particles of golden hamsters. (B) Numbers of published (black) or newly detected (red) proteins compared with the VLDL/LDL/HDL proteome lists (Excel S1‐1/2/3). (C) Numbers of validated proteins by PRM proteomics. Black: total numbers; red: numbers of new proteins. (D‐J) Abundance heatmaps of 46 validated proteins in VLDL/LDL/HDL of normal golden hamsters using PRM targeted data. Left: Heatmaps of protein abundance. Right: Ten functional panels organized by biological functions and protein‐protein interaction in the STRING database. Each protein abundance in lipoprotein particles was from the normalized abundance by PRM quantitative proteomics. A value of 1.00 was assigned to the highest abundance of the specific protein among three lipoproteins, and other ratios were calculated accordingly. The highest value to the lowest are colored from red to green.