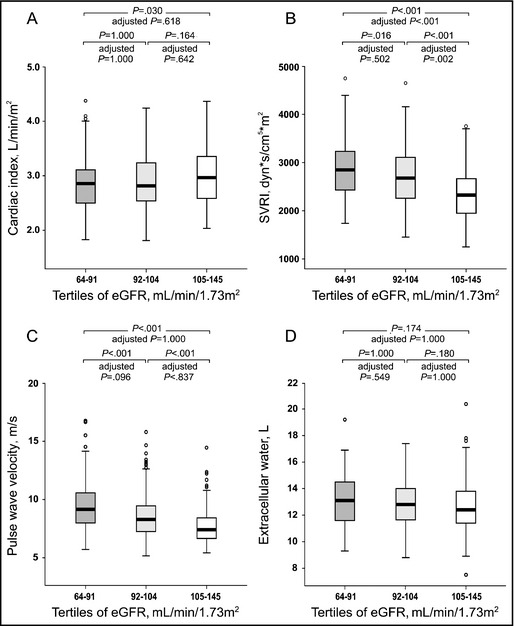
Figure 2.

Cardiac index (A), systemic vascular resistance index (SVRI) (B), pulse wave velocity (C), and volume of extracellular water (D) depicted in tertiles of estimated glomerular filtration rate (eGFR). Median (thick line inside box), 25th to 75th percentile (box), range (whiskers), and outliers (circles). P values for unadjusted analyses, and P values adjusted for differences in age, waist:height ratio, low‐density lipoprotein cholesterol, and sex (and weight in analyses of extracellular water).
