
Figure 2.
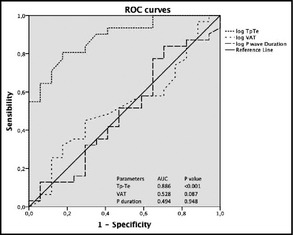
Receiver operating characteristics (ROC) curves illustrating ability of Tp‐Te interval, ventricular activation time (VAT), and average P duration to predict presence of hypertension.
Official websites use .gov
A
.gov website belongs to an official
government organization in the United States.
Secure .gov websites use HTTPS
A lock (
) or https:// means you've safely
connected to the .gov website. Share sensitive
information only on official, secure websites.
Receiver operating characteristics (ROC) curves illustrating ability of Tp‐Te interval, ventricular activation time (VAT), and average P duration to predict presence of hypertension.