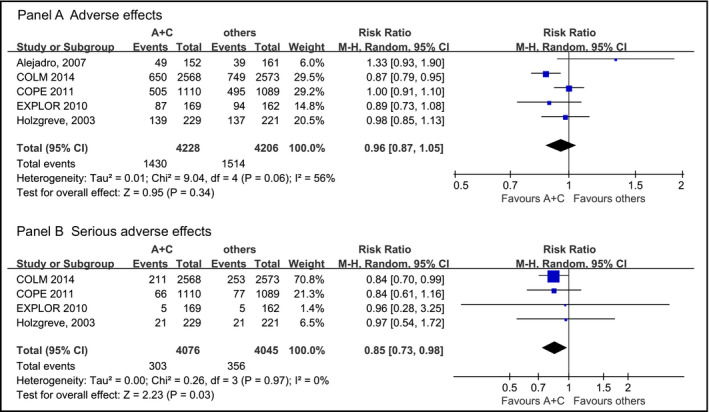
Figure 4.

Forest plot of risk ratio (RR) and 95% confidence interval (CI) for adverse events (AEs) and serious AEs between angiotensin‐converting enzyme inhibitor/angiotensin receptor blocker plus calcium channel blocker (A+C) combination therapy and other therapies (other). Boxes and solid lines indicate mean difference and 95% CI, respectively, for each study. Diamonds and their width indicate the pooled mean difference and the 95% CI, respectively. See text for trial expansions.
