
Figure 4.
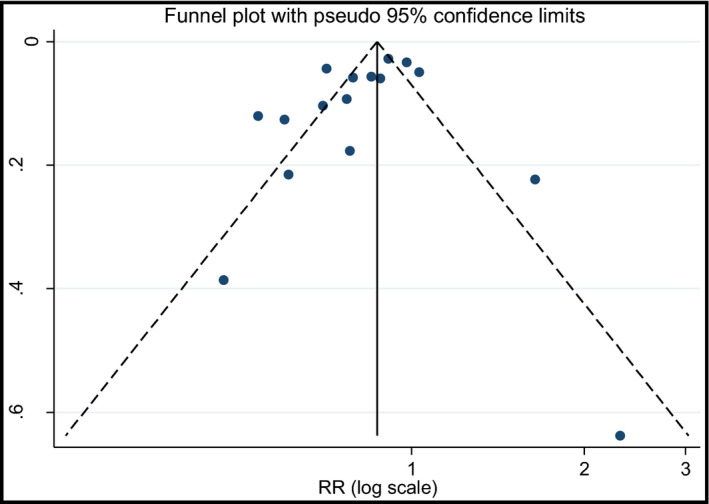
Funnel plot with pseudo 95% confidence limits for the analysis of fruit and vegetables consumption and risk of hypertension. s.e. indicates standard error; RR, relative risk.
Official websites use .gov
A
.gov website belongs to an official
government organization in the United States.
Secure .gov websites use HTTPS
A lock (
) or https:// means you've safely
connected to the .gov website. Share sensitive
information only on official, secure websites.
Funnel plot with pseudo 95% confidence limits for the analysis of fruit and vegetables consumption and risk of hypertension. s.e. indicates standard error; RR, relative risk.