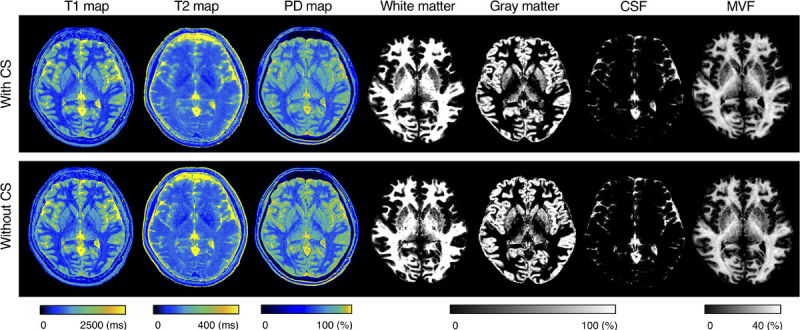
FIGURE 1.

Representative quantification maps and tissue fraction maps of a healthy volunteer. Axial images of T1, T2, and PD maps, and segmentation results for white matter, gray matter, cerebrospinal fluid, and myelin volume fraction. Minimal differences are observed between the maps obtained with and without CS. PD, proton density; CSF, cerebrospinal fluid; MVF, myelin volume fraction; CS, compressed sensing.
