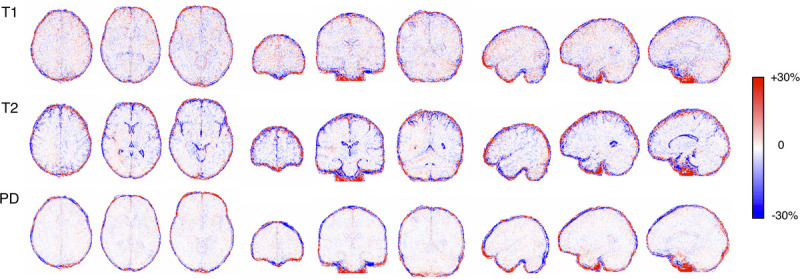
FIGURE 2.

Images show relative differences in T1, T2, and PD values between with and without CS. Maps were calculated by subtraction (quantitative values acquired with CS minus those without) divided by their mean on a group level. Different metrics (rows) and sections (columns) are shown. Red and blue indicates larger and smaller value with CS than without, respectively.
