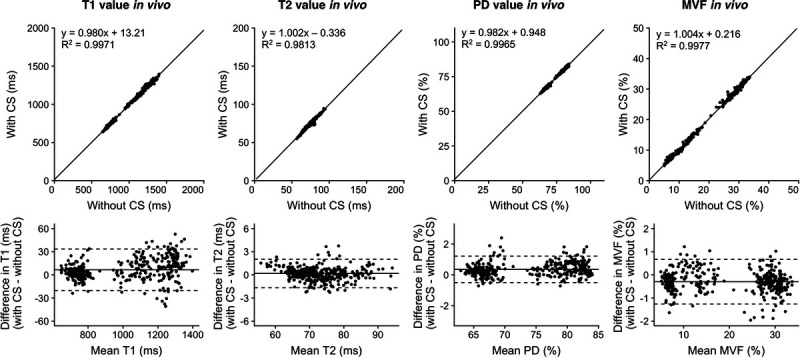
FIGURE 4.

Scatterplots and Bland-Altman plots comparing T1, T2, PD, and MVF values of 16 brain regions of 10 volunteers and 12 patients with MS, which were calculated from 3D-QALAS with CS compared with those calculated without CS. Solid black lines in the scatterplots represent the linear regression fit, and the center solid lines in the Bland-Altman plots represent mean differences. The upper and lower dotted lines represent the agreement limit, which was defined as the mean difference ± 1.96 × SD of the difference between the values acquired with and without CS. SD, standard deviation. PD, proton density; MVF, myelin volume fraction.
