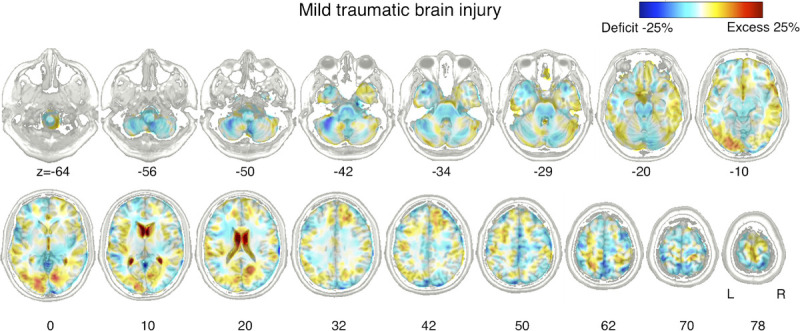
FIGURE 2.

Ratio of the mean volume in the individuals with mTBI relative to that of controls. Percentage difference between the average volumes of the two groups were visualized in blue-red representing volume contraction and expansion compared with the controls.
