
FIGURE 3.
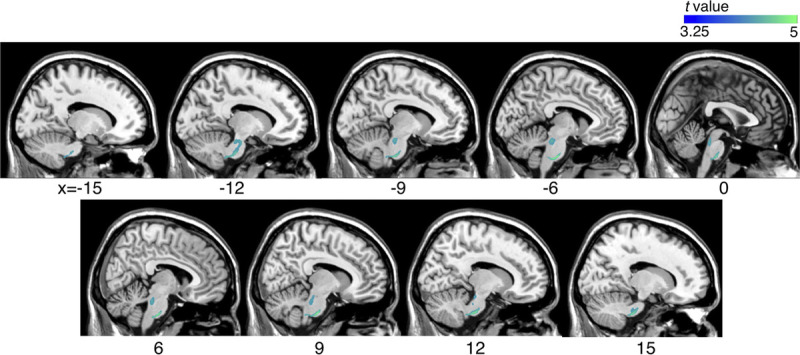
Comparison of volume changes between the mTBI and the control groups using tensor-based morphometry. Volume contraction in individuals with mTBI was compared with controls (uncorrected P < 0.001; with cluster-based family-wise ratio correction, P < 0.05). Blue represents the areas where volume contraction was observed in the mTBI group.