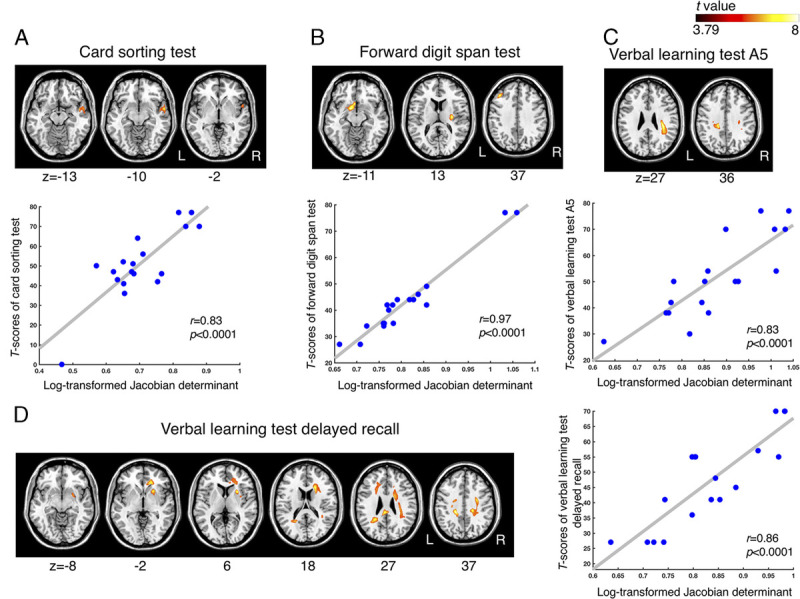
FIGURE 4.

Regression analysis of the relationship between regional brain volume and neurocognitive performance. The brain areas show a significant positive correlation with (A) executive function assessed using the card sorting test, (B) memory function assessed using the forward digit span test, (C) A5 verbal learning test, and (D) delayed recall verbal learning test (uncorrected P < 0.001; with cluster-based family-wise ratio correction, P < 0.05). The hot color map represents the brain region where its volume is positively correlated with cognitive scores. The scatterplots display the correlation between the averaged log-transformed Jacobian determinant values of the brain areas in the individuals with mTBI and the T scores of (A) the card sorting test, (B) forward digit span test, (C) A5 verbal learning test, and (D) delayed recall verbal learning test.
