
Figure 3.
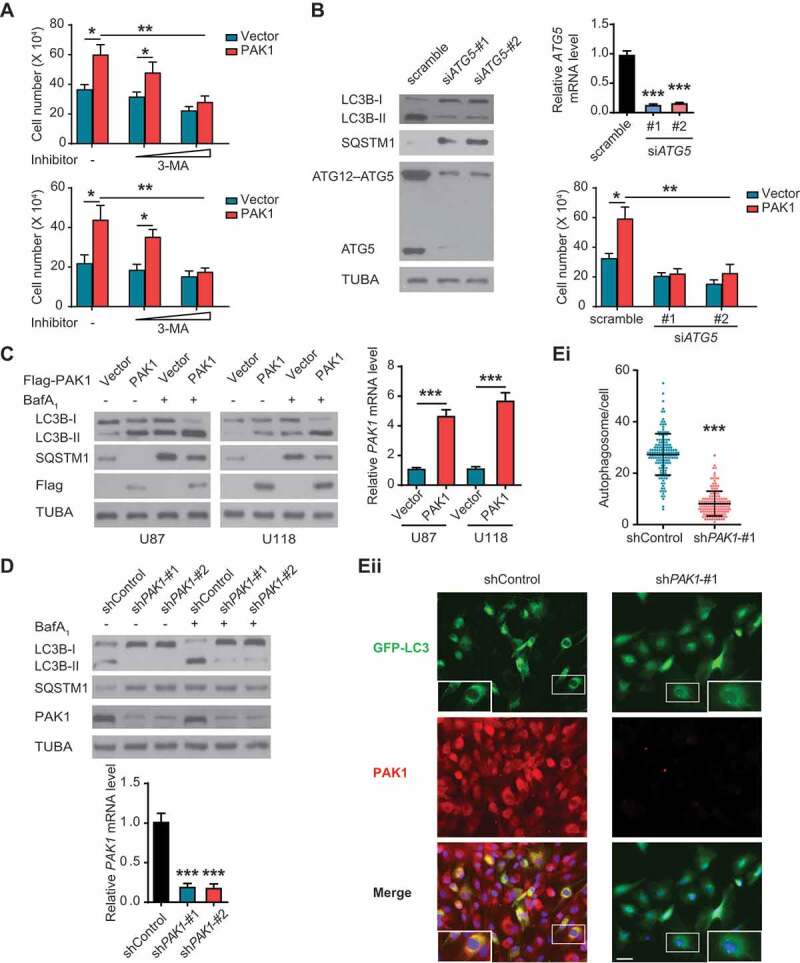
PAK1 promotes autophagy which is needed for PAK1-enhanced GBM cell proliferation. (A) U87 and U118 cells were transfected with or without PAK1 construct in combination with or without increasing concentrations of 3-MA (1 and 10 mM). Cells were subjected to hypoxia, the relative number of cells was quantified using MTT assay. Each sample was performed in triplicate. (B) U87 cells were overexpressed with or without PAK1, together with or without siRNA targeting ATG5. Cells were subjected to hypoxia. Relative cell numbers were then quantitated as in A. Immunoblotting assay (left panel) and qRT-PCR (right panel) using lysates from transfected U87 cells was performed to demonstrate ATG5 knockdown and assess autophagy. (C) U87 and U118 cells were transfected with a control vector or PAK1 construct. Then cells were subjected to hypoxia, with or without treatment of BafA1. Western blots were performed as indicated (left panel) and qRT-PCR (right panel) to demonstrate PAK1 overexpression. (D and E) LN229 cells were transfected with PAK1 shRNA-#1 or -#2, respectively. Then cells were subjected to hypoxia, with or without treatment of BafA1. qRT-PCR was performed to demonstrate PAK1 knockdown (D lower panel). The level of LC3B-II was shown (D, upper panel). Representative figure of GFP-LC3 puncta (Eii) and the quantification of autophagosomes (Ei, data was shown as the mean ± SD of 150 cells) was shown. Scale bar: 0.05 mm